Dr-Charts alternatives and similar libraries
Based on the "Charts" category.
Alternatively, view Dr-Charts alternatives based on common mentions on social networks and blogs.
-
Scrollable-GraphView
An adaptive scrollable graph view for iOS to visualise simple discrete datasets. Written in Swift. -
FSInteractiveMap
A charting library to visualize and interact with a vector map on iOS. It's like Geochart but for iOS! -
ANDLineChartView
ANDLineChartView is easy to use view-based class for displaying animated line chart. -
TWRCharts
An iOS wrapper for ChartJS. Easily build animated charts by leveraging the power of native Obj-C code.
InfluxDB - Power Real-Time Data Analytics at Scale

* Code Quality Rankings and insights are calculated and provided by Lumnify.
They vary from L1 to L5 with "L5" being the highest.
Do you think we are missing an alternative of Dr-Charts or a related project?
README
dr-charts
Easy to use, customizable and interactive charts library for iOS in Objective-C
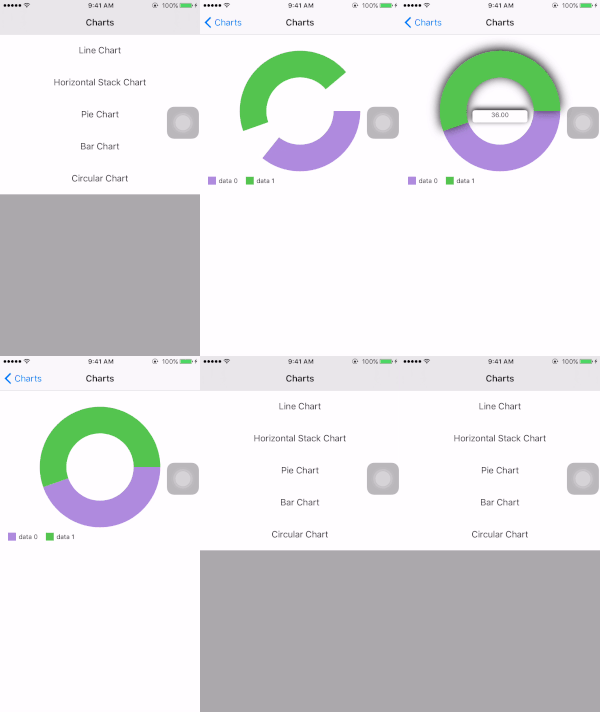
Features:
- Multiple chart types
- Line / Multiple lines / Lines Parallel To X and Y -Axis
- Circular Charts
- Vertical Bar Charts
- Horizontal Stack Charts
- Pie Chart
- Easy to use: no learning curve, no complicated settings - just assemble Charts with the help of DataSource.
- Interactivity support - Easily accessible using the Delegates
- Extremely customizable
Objective-C, iOS 8+
Demo
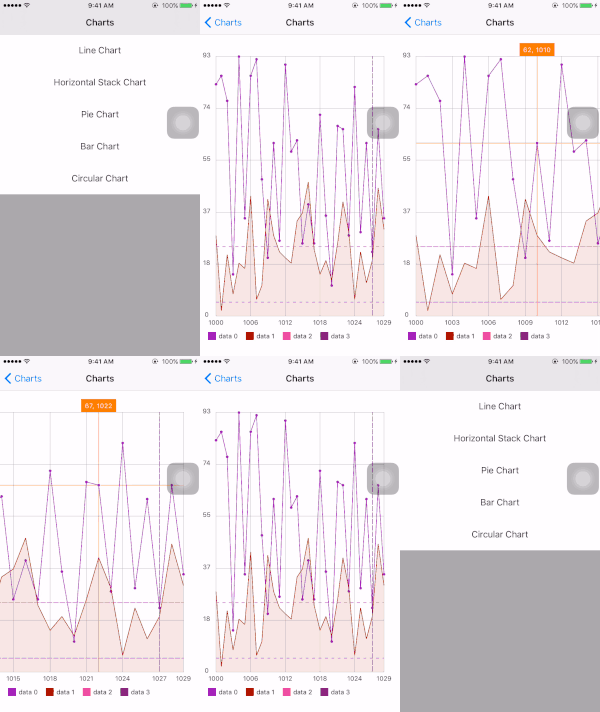
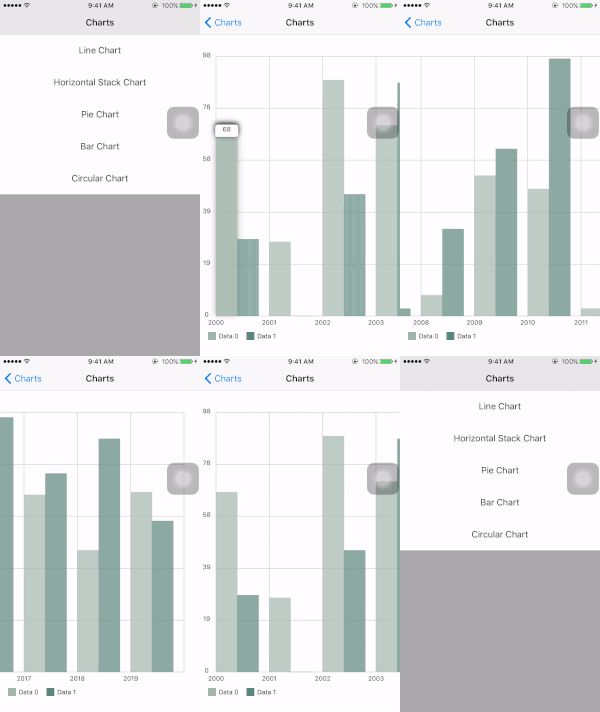
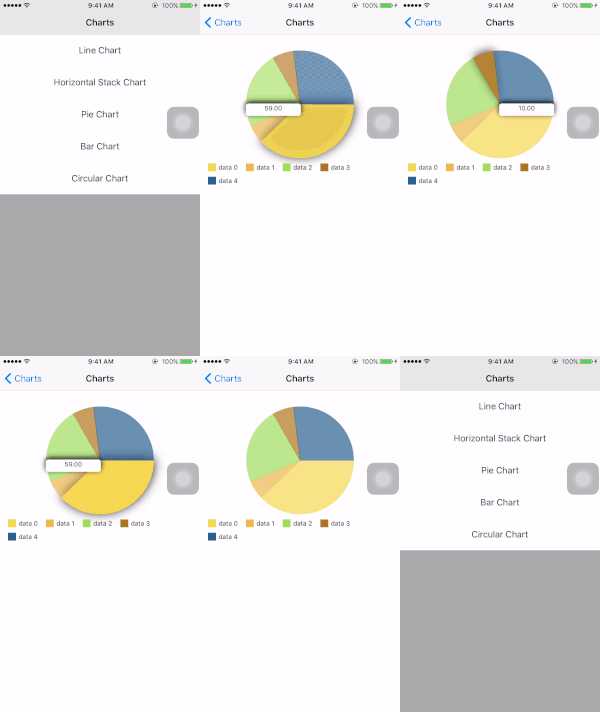
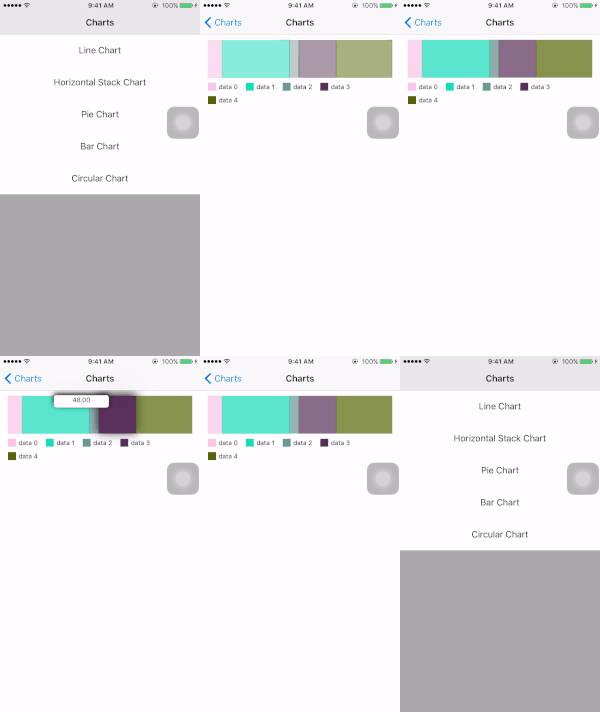
Installation
CocoaPods is the recommended way to add Dr-Charts to your project.
Using CocoaPod
Simply add the following line to your Podfile and install the pod.
pod 'drCharts', :git => 'https://github.com/Zomato/DR-charts.git'
Where "dr-charts" is the name of the library.
The Old School Way
The simplest way to add Dr-Charts to your project is to drag and drop the /Classes folder into your Xcode project. It is also recommended to rename the /Classes folder to something more descriptive (i.e. 'Dr-Charts').
CHART TYPE
Line Chart
This is an example of Line Chart:
Set Properties
pragma Mark CreateLineGraph
- (void)createLineGraph{
    MultiLineGraphView *graph = [[MultiLineGraphView alloc] initWithFrame:CGRectMake(0, header_height, WIDTH(self.view), HEIGHT(self.view) - header_height)];

    [graph setDelegate:self];
    [graph setDataSource:self];

    [graph setShowLegend:TRUE];
    [graph setLegendViewType:LegendTypeHorizontal];

    [graph setDrawGridY:TRUE];
    [graph setDrawGridX:TRUE];

    [graph setGridLineColor:[UIColor lightGrayColor]];
    [graph setGridLineWidth:0.3];

    [graph setTextFontSize:12];
    [graph setTextColor:[UIColor blackColor]];
    [graph setTextFont:[UIFont systemFontOfSize:graph.textFontSize]];

    [graph setMarkerColor:[UIColor orangeColor]];
    [graph setMarkerTextColor:[UIColor whiteColor]];
    [graph setMarkerWidth:0.4];
    [graph setShowMarker:TRUE];
    [graph showCustomMarkerView:TRUE];

    [graph drawGraph];
    [self.view addSubview:graph];
}
Set DataSource
#pragma mark MultiLineGraphViewDataSource
- (NSMutableArray *)xDataForLineToBePlotted{
    NSMutableArray *array = [[NSMutableArray alloc] init];
    for (int i = 0; i < 30; i++) {
        [array addObject:[NSString stringWithFormat:@"%d", 1000 + i]];
    }
    return array;
}
- (NSInteger)numberOfLinesToBePlotted{
    return 2;
}
- (LineDrawingType)typeOfLineToBeDrawnWithLineNumber:(NSInteger)lineNumber{
    switch (lineNumber) {
        case 0:
            return LineDefault;
            break;
        case 1:
            return LineParallelXAxis;
            break;
    }
    return LineDefault;
}
- (UIColor *)colorForTheLineWithLineNumber:(NSInteger)lineNumber{
    NSInteger aRedValue = arc4random()%255;
    NSInteger aGreenValue = arc4random()%255;
    NSInteger aBlueValue = arc4random()%255;
    UIColor *randColor = [UIColor colorWithRed:aRedValue/255.0f green:aGreenValue/255.0f blue:aBlueValue/255.0f alpha:1.0f];
    return randColor;
}
- (CGFloat)widthForTheLineWithLineNumber:(NSInteger)lineNumber{
    return 1;
}
- (NSString *)nameForTheLineWithLineNumber:(NSInteger)lineNumber{
    return [NSString stringWithFormat:@"data %ld",(long)lineNumber];
}
- (BOOL)shouldFillGraphWithLineNumber:(NSInteger)lineNumber{
    switch (lineNumber) {
        case 0:
            return false;
            break;
        case 1:
            return true;
            break;
    }
    return false;
}
- (BOOL)shouldDrawPointsWithLineNumber:(NSInteger)lineNumber{
    switch (lineNumber) {
        case 0:
            return true;
            break;
        case 1:
            return false;
            break;
    }
    return false;
}
- (NSMutableArray *)dataForLineWithLineNumber:(NSInteger)lineNumber{
    switch (lineNumber) {
        case 0:
        {
            NSMutableArray *array = [[NSMutableArray alloc] init];
            for (int i = 0; i < 30; i++) {
                [array addObject:[NSNumber numberWithLong:random() % 100]];
            }
            return array;
        }
            break;
        case 1:
        {
            NSMutableArray *array = [[NSMutableArray alloc] init];
            [array addObject:[NSNumber numberWithLong:random() % 100]];
            [array addObject:[NSNumber numberWithLong:random() % 100]];

            return array;
        }
            break;
    }
    return [[NSMutableArray alloc] init];
}

- (UIView *)customViewForLineChartTouchWithXValue:(NSNumber *)xValue andYValue:(NSNumber *)yValue{
    UIView *view = [[UIView alloc] init];
    [view setBackgroundColor:[UIColor whiteColor]];
    [view.layer setCornerRadius:4.0F];
    [view.layer setBorderWidth:1.0F];
    [view.layer setBorderColor:[[UIColor lightGrayColor] CGColor]];
    [view.layer setShadowColor:[[UIColor blackColor] CGColor]];
    [view.layer setShadowRadius:2.0F];
    [view.layer setShadowOpacity:0.3F];

    UILabel *label = [[UILabel alloc] init];
    [label setFont:[UIFont systemFontOfSize:12]];
    [label setTextAlignment:NSTextAlignmentCenter];
    [label setText:[NSString stringWithFormat:@"Line Data: %@", yValue]];
    [label setFrame:CGRectMake(0, 0, 100, 30)];
    [view addSubview:label];

    [view setFrame:label.frame];
    return view;
}
Set Delegate
#pragma mark MultiLineGraphViewDelegate
- (void)didTapWithValuesAtX:(NSString *)xValue valuesAtY:(NSString *)yValue{
    NSLog(@"Line Chart: Value-X:%@, Value-Y:%@",xValue, yValue);
}
Bar Chart
This is an example of a Bar Chart:
Set Properties
#pragma Mark CreateHorizontalChart
- (void)createBarChart{
    BarChart *barChartView = [[BarChart alloc] initWithFrame:CGRectMake(0, header_height, WIDTH(self.view), HEIGHT(self.view) - header_height)];
    [barChartView setDataSource:self];
    [barChartView setDelegate:self];

    [barChartView setShowLegend:TRUE];
    [barChartView setLegendViewType:LegendTypeHorizontal];

    [barChartView setDrawGridY:TRUE];
    [barChartView setDrawGridX:TRUE];

    [barChartView setGridLineColor:[UIColor lightGrayColor]];
    [barChartView setGridLineWidth:0.3];

    [barChartView setTextFontSize:12];
    [barChartView setTextColor:[UIColor blackColor]];
    [barChartView setTextFont:[UIFont systemFontOfSize:barChartView.textFontSize]];

    [barChartView setShowCustomMarkerView:TRUE];
    [barChartView drawBarGraph];

    [self.view addSubview:barChartView];
}
Set DataSource
#pragma mark BarChartDataSource
- (NSMutableArray *)xDataForBarChart{
    NSMutableArray *array = [[NSMutableArray alloc] init];
    for (int i = 0; i < 20; i++) {
        [array addObject:[NSString stringWithFormat:@"%d", 2000 + i]];
    }
    return  array;
}

- (NSInteger)numberOfBarsToBePlotted{
    return 2;
}

- (UIColor *)colorForTheBarWithBarNumber:(NSInteger)barNumber{
    NSInteger aRedValue = arc4random()%255;
    NSInteger aGreenValue = arc4random()%255;
    NSInteger aBlueValue = arc4random()%255;
    UIColor *randColor = [UIColor colorWithRed:aRedValue/255.0f green:aGreenValue/255.0f blue:aBlueValue/255.0f alpha:1.0f];
    return randColor;
}

- (CGFloat)widthForTheBarWithBarNumber:(NSInteger)barNumber{
    return 40;
}

- (NSString *)nameForTheBarWithBarNumber:(NSInteger)barNumber{
    return [NSString stringWithFormat:@"Data %d",(int)barNumber];
}

- (NSMutableArray *)yDataForBarWithBarNumber:(NSInteger)barNumber{
    NSMutableArray *array = [[NSMutableArray alloc] init];
    for (int i = 0; i < 20; i++) {
        [array addObject:[NSNumber numberWithLong:random() % 100]];
    }
    return array;
}

- (UIView *)customViewForBarChartTouchWithValue:(NSNumber *)value{
    UIView *view = [[UIView alloc] init];
    [view setBackgroundColor:[UIColor whiteColor]];
    [view.layer setCornerRadius:4.0F];
    [view.layer setBorderWidth:1.0F];
    [view.layer setBorderColor:[[UIColor lightGrayColor] CGColor]];
    [view.layer setShadowColor:[[UIColor blackColor] CGColor]];
    [view.layer setShadowRadius:2.0F];
    [view.layer setShadowOpacity:0.3F];

    UILabel *label = [[UILabel alloc] init];
    [label setFont:[UIFont systemFontOfSize:12]];
    [label setTextAlignment:NSTextAlignmentCenter];
    [label setText:[NSString stringWithFormat:@"Bar Data: %@", value]];
    [label setFrame:CGRectMake(0, 0, 100, 30)];
    [view addSubview:label];

    [view setFrame:label.frame];
    return view;
}
Set Delegate
#pragma mark BarChartDelegate
- (void)didTapOnBarChartWithValue:(NSString *)value{
    NSLog(@"Bar Chart: %@",value);
}
Pie Chart
This is an example of Pie Chart
Set Properties
#pragma Mark CreatePieChart
- (void)createPieChart{
    PieChart *chart = [[PieChart alloc] initWithFrame:CGRectMake(0, header_height, WIDTH(self.view), (HEIGHT(self.view) - header_height)/2)];
    [chart setDataSource:self];
    [chart setDelegate:self];

    [chart setShowLegend:TRUE];
    [chart setLegendViewType:LegendTypeHorizontal];

    [chart setTextFontSize:12];
    [chart setTextColor:[UIColor blackColor]];
    [chart setTextFont:[UIFont systemFontOfSize:chart.textFontSize]];

    [chart setShowValueOnPieSlice:TRUE];
    [chart setShowCustomMarkerView:TRUE];

    [chart drawPieChart];
    [self.view addSubview:chart];
}
Set DataSource
#pragma mark PieChartDataSource
- (NSInteger)numberOfValuesForPieChart{
    return 5;
}

- (UIColor *)colorForValueInPieChartWithIndex:(NSInteger)lineNumber{
    NSInteger aRedValue = arc4random()%255;
    NSInteger aGreenValue = arc4random()%255;
    NSInteger aBlueValue = arc4random()%255;
    UIColor *randColor = [UIColor colorWithRed:aRedValue/255.0f green:aGreenValue/255.0f blue:aBlueValue/255.0f alpha:1.0f];
    return randColor;
}

- (NSString *)titleForValueInPieChartWithIndex:(NSInteger)index{
    return [NSString stringWithFormat:@"data %ld",(long)index];
}

- (NSNumber *)valueInPieChartWithIndex:(NSInteger)index{
    return [NSNumber numberWithLong:random() % 100];
}

- (UIView *)customViewForPieChartTouchWithValue:(NSNumber *)value{
    UIView *view = [[UIView alloc] init];
    [view setBackgroundColor:[UIColor whiteColor]];
    [view.layer setCornerRadius:4.0F];
    [view.layer setBorderWidth:1.0F];
    [view.layer setBorderColor:[[UIColor lightGrayColor] CGColor]];
    [view.layer setShadowColor:[[UIColor blackColor] CGColor]];
    [view.layer setShadowRadius:2.0F];
    [view.layer setShadowOpacity:0.3F];

    UILabel *label = [[UILabel alloc] init];
    [label setFont:[UIFont systemFontOfSize:12]];
    [label setTextAlignment:NSTextAlignmentCenter];
    [label setText:[NSString stringWithFormat:@"Pie Data: %@", value]];
    [label setFrame:CGRectMake(0, 0, 100, 30)];
    [view addSubview:label];

    [view setFrame:label.frame];
    return view;
}
Set Delegate
#pragma mark PieChartDelegate
- (void)didTapOnPieChartWithValue:(NSString *)value{
    NSLog(@"Pie Chart: %@",value);
}
Horizontal Stack Chart
This is an example of Horizontal Stack Chart
Set Properties
#pragma Mark CreateHorizontalChart
- (void)createHorizontalStackChart{
    HorizontalStackBarChart *chartView = [[HorizontalStackBarChart alloc] initWithFrame:CGRectMake(0, header_height, WIDTH(self.view), 150)];
    [chartView setDataSource:self];
    [chartView setDelegate:self];

    [chartView setShowLegend:TRUE];
    [chartView setLegendViewType:LegendTypeHorizontal];

    [chartView setTextFontSize:12];
    [chartView setTextColor:[UIColor blackColor]];
    [chartView setTextFont:[UIFont systemFontOfSize:chartView.textFontSize]];

    [chartView setShowValueOnBarSlice:TRUE];
    [chartView setShowCustomMarkerView:TRUE];

    [chartView drawStackChart];
    [self.view addSubview:chartView];
}
Set DataSource
#pragma mark HorizontalStackBarChartDataSource
- (NSInteger)numberOfValuesForStackChart{
    return 5;
}

- (UIColor *)colorForValueInStackChartWithIndex:(NSInteger)index{
    NSInteger aRedValue = arc4random()%255;
    NSInteger aGreenValue = arc4random()%255;
    NSInteger aBlueValue = arc4random()%255;
    UIColor *randColor = [UIColor colorWithRed:aRedValue/255.0f green:aGreenValue/255.0f blue:aBlueValue/255.0f alpha:1.0f];
    return randColor;
}

- (NSString *)titleForValueInStackChartWithIndex:(NSInteger)index{
    return [NSString stringWithFormat:@"data %ld",(long)index];
}

- (NSNumber *)valueInStackChartWithIndex:(NSInteger)index{
    return [NSNumber numberWithLong:random() % 100];
}

- (UIView *)customViewForStackChartTouchWithValue:(NSNumber *)value{
    UIView *view = [[UIView alloc] init];
    [view setBackgroundColor:[UIColor whiteColor]];
    [view.layer setCornerRadius:4.0F];
    [view.layer setBorderWidth:1.0F];
    [view.layer setBorderColor:[[UIColor lightGrayColor] CGColor]];
    [view.layer setShadowColor:[[UIColor blackColor] CGColor]];
    [view.layer setShadowRadius:2.0F];
    [view.layer setShadowOpacity:0.3F];

    UILabel *label = [[UILabel alloc] init];
    [label setFont:[UIFont systemFontOfSize:12]];
    [label setTextAlignment:NSTextAlignmentCenter];
    [label setText:[NSString stringWithFormat:@"Stack Data: %@", value]];
    [label setFrame:CGRectMake(0, 0, 100, 30)];
    [view addSubview:label];

    [view setFrame:label.frame];
    return view;
}
Set Delegate
#pragma mark HorizontalStackBarChartDelegate
- (void)didTapOnHorizontalStackBarChartWithValue:(NSString *)value{
    NSLog(@"Horizontal Stack Chart: %@",value);
}
Circular Chart
This is an example of Circular Chart
Set Properties
#pragma Mark CreateCircularChart
- (void)createCircularChart{
    CircularChart *chart = [[CircularChart alloc] initWithFrame:CGRectMake(0, header_height, WIDTH(self.view), (HEIGHT(self.view) - header_height)/2)];
    [chart setDataSource:self];
    [chart setDelegate:self];

    [chart setShowLegend:TRUE];
    [chart setLegendViewType:LegendTypeHorizontal];

    [chart setTextFontSize:12];
    [chart setTextColor:[UIColor blackColor]];
    [chart setTextFont:[UIFont systemFontOfSize:chart.textFontSize]];

    [chart setShowCustomMarkerView:TRUE];

    [chart drawPieChart];
    [self.view addSubview:chart];
}
Set DataSource
#pragma mark CircularChartDataSource
- (CGFloat)strokeWidthForCircularChart{
    return 50;
}

- (NSInteger)numberOfValuesForCircularChart{
    return 2;
}

- (UIColor *)colorForValueInCircularChartWithIndex:(NSInteger)lineNumber{
    NSInteger aRedValue = arc4random()%255;
    NSInteger aGreenValue = arc4random()%255;
    NSInteger aBlueValue = arc4random()%255;
    UIColor *randColor = [UIColor colorWithRed:aRedValue/255.0f green:aGreenValue/255.0f blue:aBlueValue/255.0f alpha:1.0f];
    return randColor;
}

- (NSString *)titleForValueInCircularChartWithIndex:(NSInteger)index{
    return [NSString stringWithFormat:@"data %ld",(long)index];
}

- (NSNumber *)valueInCircularChartWithIndex:(NSInteger)index{
    return [NSNumber numberWithLong:random() % 100];
}

- (UIView *)customViewForCircularChartTouchWithValue:(NSNumber *)value{
    UIView *view = [[UIView alloc] init];
    [view setBackgroundColor:[UIColor whiteColor]];
    [view.layer setCornerRadius:4.0F];
    [view.layer setBorderWidth:1.0F];
    [view.layer setBorderColor:[[UIColor lightGrayColor] CGColor]];
    [view.layer setShadowColor:[[UIColor blackColor] CGColor]];
    [view.layer setShadowRadius:2.0F];
    [view.layer setShadowOpacity:0.3F];

    UILabel *label = [[UILabel alloc] init];
    [label setFont:[UIFont systemFontOfSize:12]];
    [label setTextAlignment:NSTextAlignmentCenter];
    [label setText:[NSString stringWithFormat:@"Circular Data: %@", value]];
    [label setFrame:CGRectMake(0, 0, 100, 30)];
    [label setAdjustsFontSizeToFitWidth:TRUE];
    [view addSubview:label];

    [view setFrame:label.frame];
    return view;
}
Set Delegate
#pragma mark CircularChartDelegate
- (void)didTapOnCircularChartWithValue:(NSString *)value{
    NSLog(@"Circular Chart: %@",value);
}

