JYRadarChart alternatives and similar libraries
Based on the "Charts" category.
Alternatively, view JYRadarChart alternatives based on common mentions on social networks and blogs.
-
Scrollable-GraphView
An adaptive scrollable graph view for iOS to visualise simple discrete datasets. Written in Swift. -
FSInteractiveMap
A charting library to visualize and interact with a vector map on iOS. It's like Geochart but for iOS! -
ANDLineChartView
ANDLineChartView is easy to use view-based class for displaying animated line chart. -
TWRCharts
An iOS wrapper for ChartJS. Easily build animated charts by leveraging the power of native Obj-C code. -
Dr-Charts
Dr-Charts is a highly customisable, easy to use and interactive chart / graph framework in Objective-C.
InfluxDB - Power Real-Time Data Analytics at Scale

* Code Quality Rankings and insights are calculated and provided by Lumnify.
They vary from L1 to L5 with "L5" being the highest.
Do you think we are missing an alternative of JYRadarChart or a related project?
README
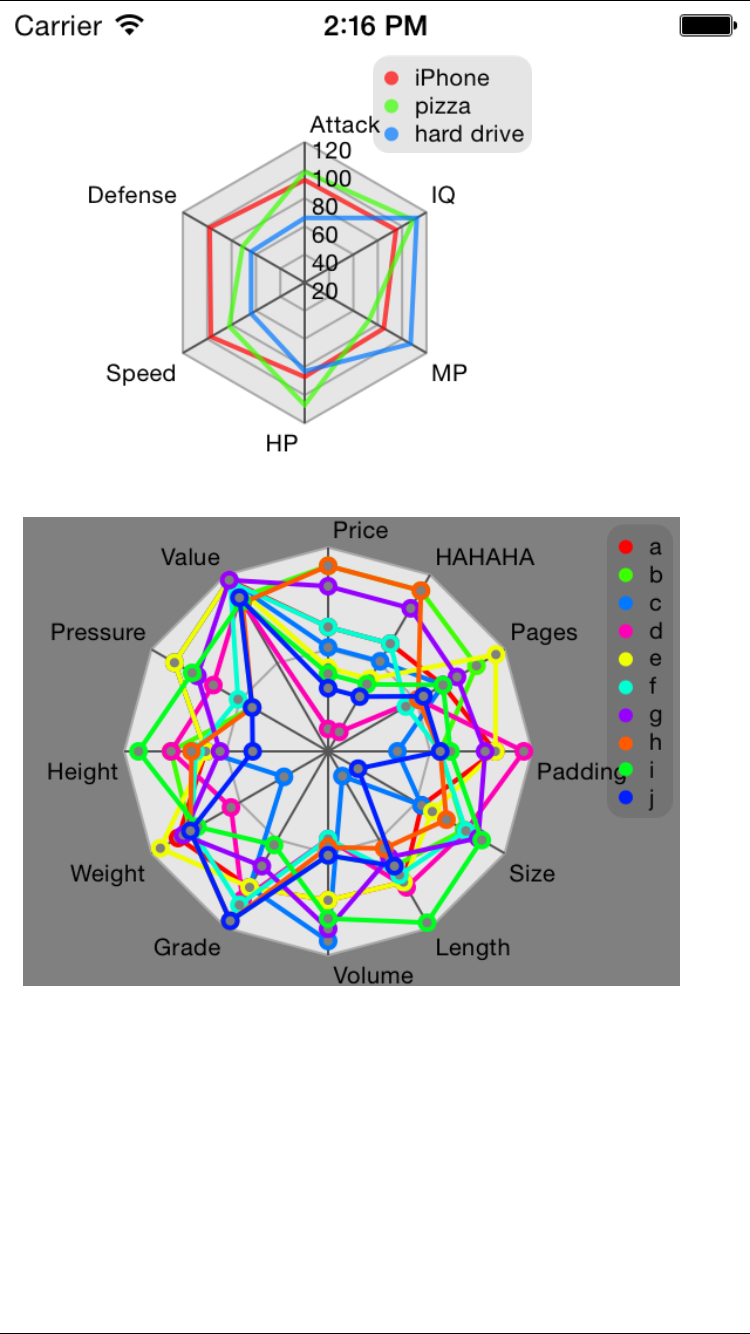
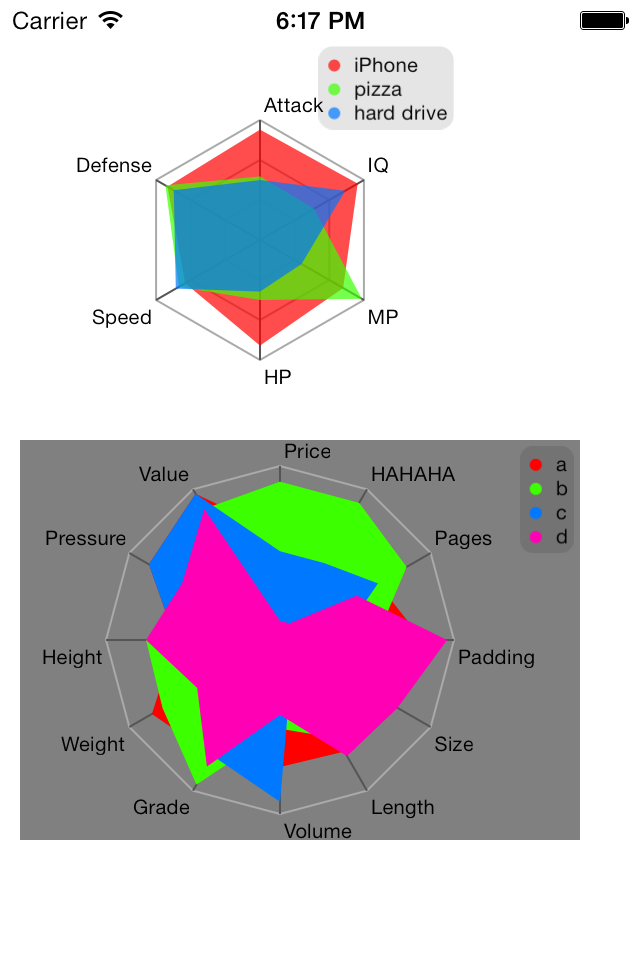
JYRadarChart
an open source iOS Radar Chart implementation
Screenshots


Requirements
- Xcode 5 or higher
- iOS 5.0 or higher
- ARC
- CoreGraphics.framework
Demo
Build and run the JYRadarChartDemo project in Xcode
Installation
CocoaPods
- Create a Podfile in your project folder if you don't have one
- Add a pod entry for JYRadarChart to your Podfile
pod 'JYRadarChart' - Install the pod(s) by running
pod install - Include JYRadarChart wherever you need it with
#import "JYRadarChart.h"
Manual Install
All you need to do is drop JYRadarChart files into your project, and add #import "JYRadarChart.h" to the top of classes that will use it.
Example Usage
minimum
JYRadarChart *p = [[JYRadarChart alloc] initWithFrame:CGRectMake(30, 20, 200, 200)];
p.dataSeries = @[@[@(51),@(44),@(94),@(84),@(90)]];
p.attributes = @[@"attack",@"defense",@"speed",@"HP",@"MP"];
[self.view addSubview:p];
fully customized
JYRadarChart *p = [[JYRadarChart alloc] initWithFrame:CGRectMake(20, 20, 200, 200)];

NSArray *a1 = @[@(81), @(97), @(87), @(60), @(65), @(77)];
NSArray *a2 = @[@(91), @(87), @(33), @(77), @(78), @(96)];

//set the data series
p.dataSeries = @[a1, a2];

//how many "circles" in the chart
p.steps = 4;

//for the the entire background
p.backgroundColor = [UIColor whiteColor];

//you can specify the background fill color
//(just for the chart, not the entire background of the view)
p.backgroundFillColor = [UIColor grayColor];

//you can set radius, min and max value by yourself, but if you
//leave r (will fill the rect), minValue (will be 0), maxValue (default is 100) alone,
//that is okay. the points with too big value will be out of the chart and thus invisible
p.r = 60;
p.minValue = 20;
p.maxValue = 120;

//you can choose whether fill area or not (just draw lines)
p.fillArea = YES;

//you can specify the opacity, default is 1.0 (opaque)
p.colorOpacity = 0.7;
p.attributes = @[@"Attack", @"Defense", @"Speed", @"HP", @"MP", @"IQ"];

//if you do not need a legend, you can safely get rid of setTitles:
p.showLegend = YES;
[p setTitles:@[@"archer", @"footman"]];

//there is a color generator in the code, it will generate colors for you
//so if you do not want to specify the colors yourself, just delete the line below
[p setColors:@[[UIColor grayColor],[UIColor blackColor]]];
[self.view addSubview:p];
Customization
here are all the properties you can change, you can find them in JYRadarChart.h
@property (nonatomic, assign) CGFloat r;
@property (nonatomic, assign) CGFloat maxValue;
@property (nonatomic, assign) CGFloat minValue;
@property (nonatomic, assign) BOOL drawPoints;
@property (nonatomic, assign) BOOL fillArea;
@property (nonatomic, assign) BOOL showLegend;
@property (nonatomic, assign) BOOL showStepText;
@property (nonatomic, assign) CGFloat colorOpacity;
@property (nonatomic, strong) UIColor *backgroundLineColorRadial;
@property (nonatomic, strong) UIColor *backgroundFillColor;
@property (nonatomic, strong) NSArray *dataSeries;
@property (nonatomic, strong) NSArray *attributes;
@property (nonatomic, assign) NSUInteger steps;
@property (nonatomic, assign) CGPoint centerPoint;

- (void)setTitles:(NSArray *)titles;
- (void)setColors:(NSArray *)colors;
Contact
johnny.wjy07#gmail.com
Feel free to send me pull requests!
Enjoy it~
License
JYRadarChart is available under the MIT license.
The MIT License (MIT)
Copyright (c) 2013 Johnny Wu
Permission is hereby granted, free of charge, to any person obtaining a copy of this software and associated documentation files (the "Software"), to deal in the Software without restriction, including without limitation the rights to use, copy, modify, merge, publish, distribute, sublicense, and/or sell copies of the Software, and to permit persons to whom the Software is furnished to do so, subject to the following conditions:
The above copyright notice and this permission notice shall be included in all copies or substantial portions of the Software.
THE SOFTWARE IS PROVIDED "AS IS", WITHOUT WARRANTY OF ANY KIND, EXPRESS OR IMPLIED, INCLUDING BUT NOT LIMITED TO THE WARRANTIES OF MERCHANTABILITY, FITNESS FOR A PARTICULAR PURPOSE AND NONINFRINGEMENT. IN NO EVENT SHALL THE AUTHORS OR COPYRIGHT HOLDERS BE LIABLE FOR ANY CLAIM, DAMAGES OR OTHER LIABILITY, WHETHER IN AN ACTION OF CONTRACT, TORT OR OTHERWISE, ARISING FROM, OUT OF OR IN CONNECTION WITH THE SOFTWARE OR THE USE OR OTHER DEALINGS IN THE SOFTWARE.
*Note that all licence references and agreements mentioned in the JYRadarChart README section above
are relevant to that project's source code only.

